Table of contents
1- Part #2 recap
2- Insights about veterans with disabilities
Part #2 recap
In part #2, we talked about the data source we are using for this project, which was the CDC’s 2020 Behavioral Risk Factor Surveillance System (BRFSS). We also specified the study sample (veterans with disabilities) and the variables we are interested in. Our research question is to assess whether there is an association between alcohol use and mental health outcomes in veterans with disabilities. In this post, we try to gain some insights about our study sample by conducting descriptive analysis to examine the demographic characteristics, mental health outcomes, and binge drinking among veterans with disabilities.
Insights about veterans with disabilities
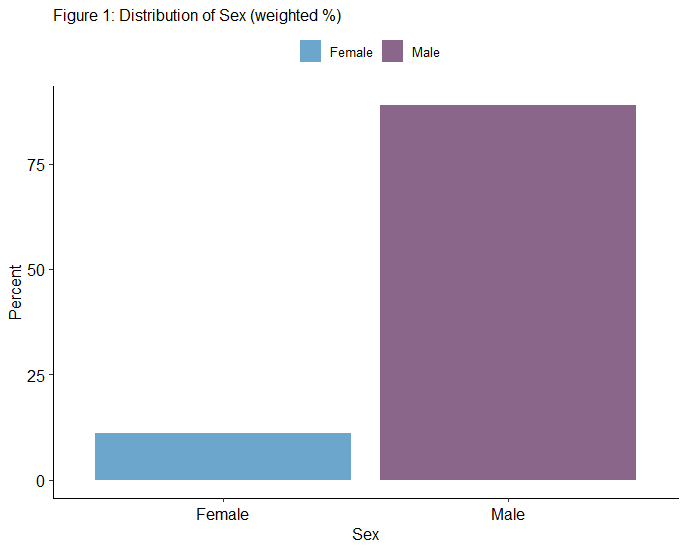
Our study sample consisted of 17,975 veterans with disabilities. As shown in Figure 1, the sample consisted of mostly male which accounted for 88.9%.
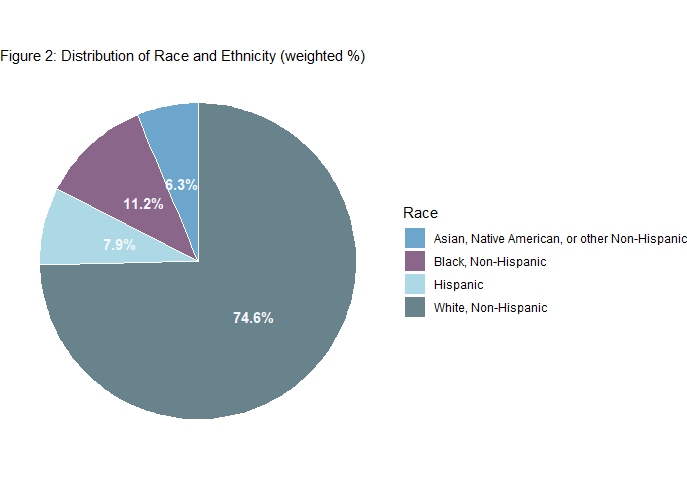
The majority of our sample were white non-hispanic (74.6%), followed by black non-hispanic (11.2%), hispanic (7.91%), and asian, native american, or other non-hispanic (6.27%) as shown in Figure 2.
Most of the veterans with disabilities in the sample were between the ages of 65 or older (55.2%), followed by veterans ages 55 to 64 (16.2%), veterans ages 45 to 54 (10.3%), veterans ages 35 to 44 (8.27%), veterans 25 to 34 (7.84%), and veterans ages 18 to 24 (2.23%).
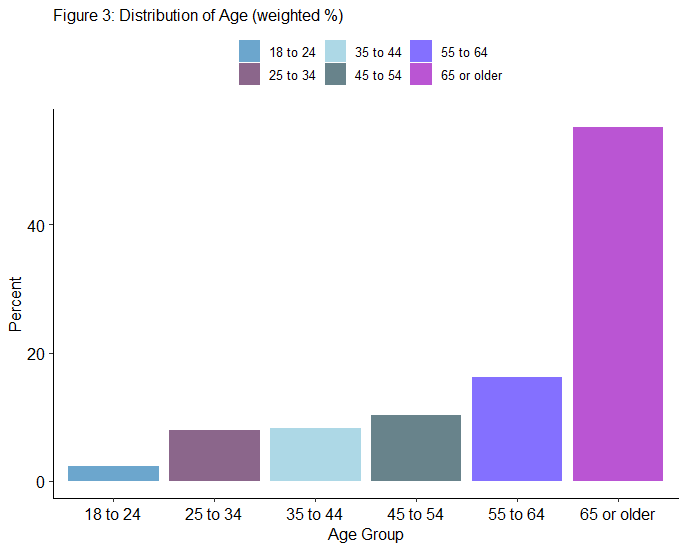
Table 1 bellow illustrates the summary of the distribution of the remaining sample characteristics related to the 17,975 veterans with disabilites including education, employment, income, marital status, binge drinking, and days mental health not good.
Table 1: Summary table of sample characteristics
| Characteristics | Unweighted n (Weighted %) |
|---|---|
| Education | |
| Did not graduate High School | 971 (8.74) |
| Graduated High School | 5,307 (31.2) |
| Attended College or Technical School | 6,077 (38.5) |
| Graduated from College or Technical School | 5,570 (21.2) |
| Don’t know/Not sure/Missing | 50 (0.37) |
| Employment | |
| Employed | 3,773 (27.6) |
| Not Employed | 3,001 (18.8) |
| Retired | 11,119 (53.1) |
| Refused/No Response | 82 (0.567) |
| Income | |
| Less than $15,000 | 1,248 (6.5) |
| $15,000 to less than $25,000 | 2,881 (14.9) |
| $25,000 to less than $35,000 | 2,011 (9.92) |
| $35,000 to less than $50,000 | 2,674 (14.6) |
| $50,000 or more | 6,143 (37.5) |
| Don’t know/Not sure/Missing | 3,018 (16.7) |
| Marital Status | |
| Married or Living With a Partner | 9,981 (58.9) |
| Separated/Divorved/Widowed | 6,619 (31.6) |
| Never Married | 1,287 (8.62) |
| Refused/No Response | 88 (0.853) |
| Binge Drinking | |
| No | 15,445 (82.3) |
| Yes | 1,740 (12.6) |
| Don’t know/Refused/Missing | 790 (5.04) |
| Days Mental Health Not Good | |
| 13 or less days when mental health not good | 14,316 (79.64) |
| 14 or more days when mental health not good | 3,131 (17.42) |
More Insights
- Only 12.6% of the sample were binge drinking (main explanatory variable).
- Only 17.42% of the sample had 14+ mentally unhealthy days (dependent variable).
- The majority of the sample were married or living with a partenr (58.9%).
- The majority of the sample were retired (53.1%) and attended college or technical school (38.5%).